Analyze your company's performance
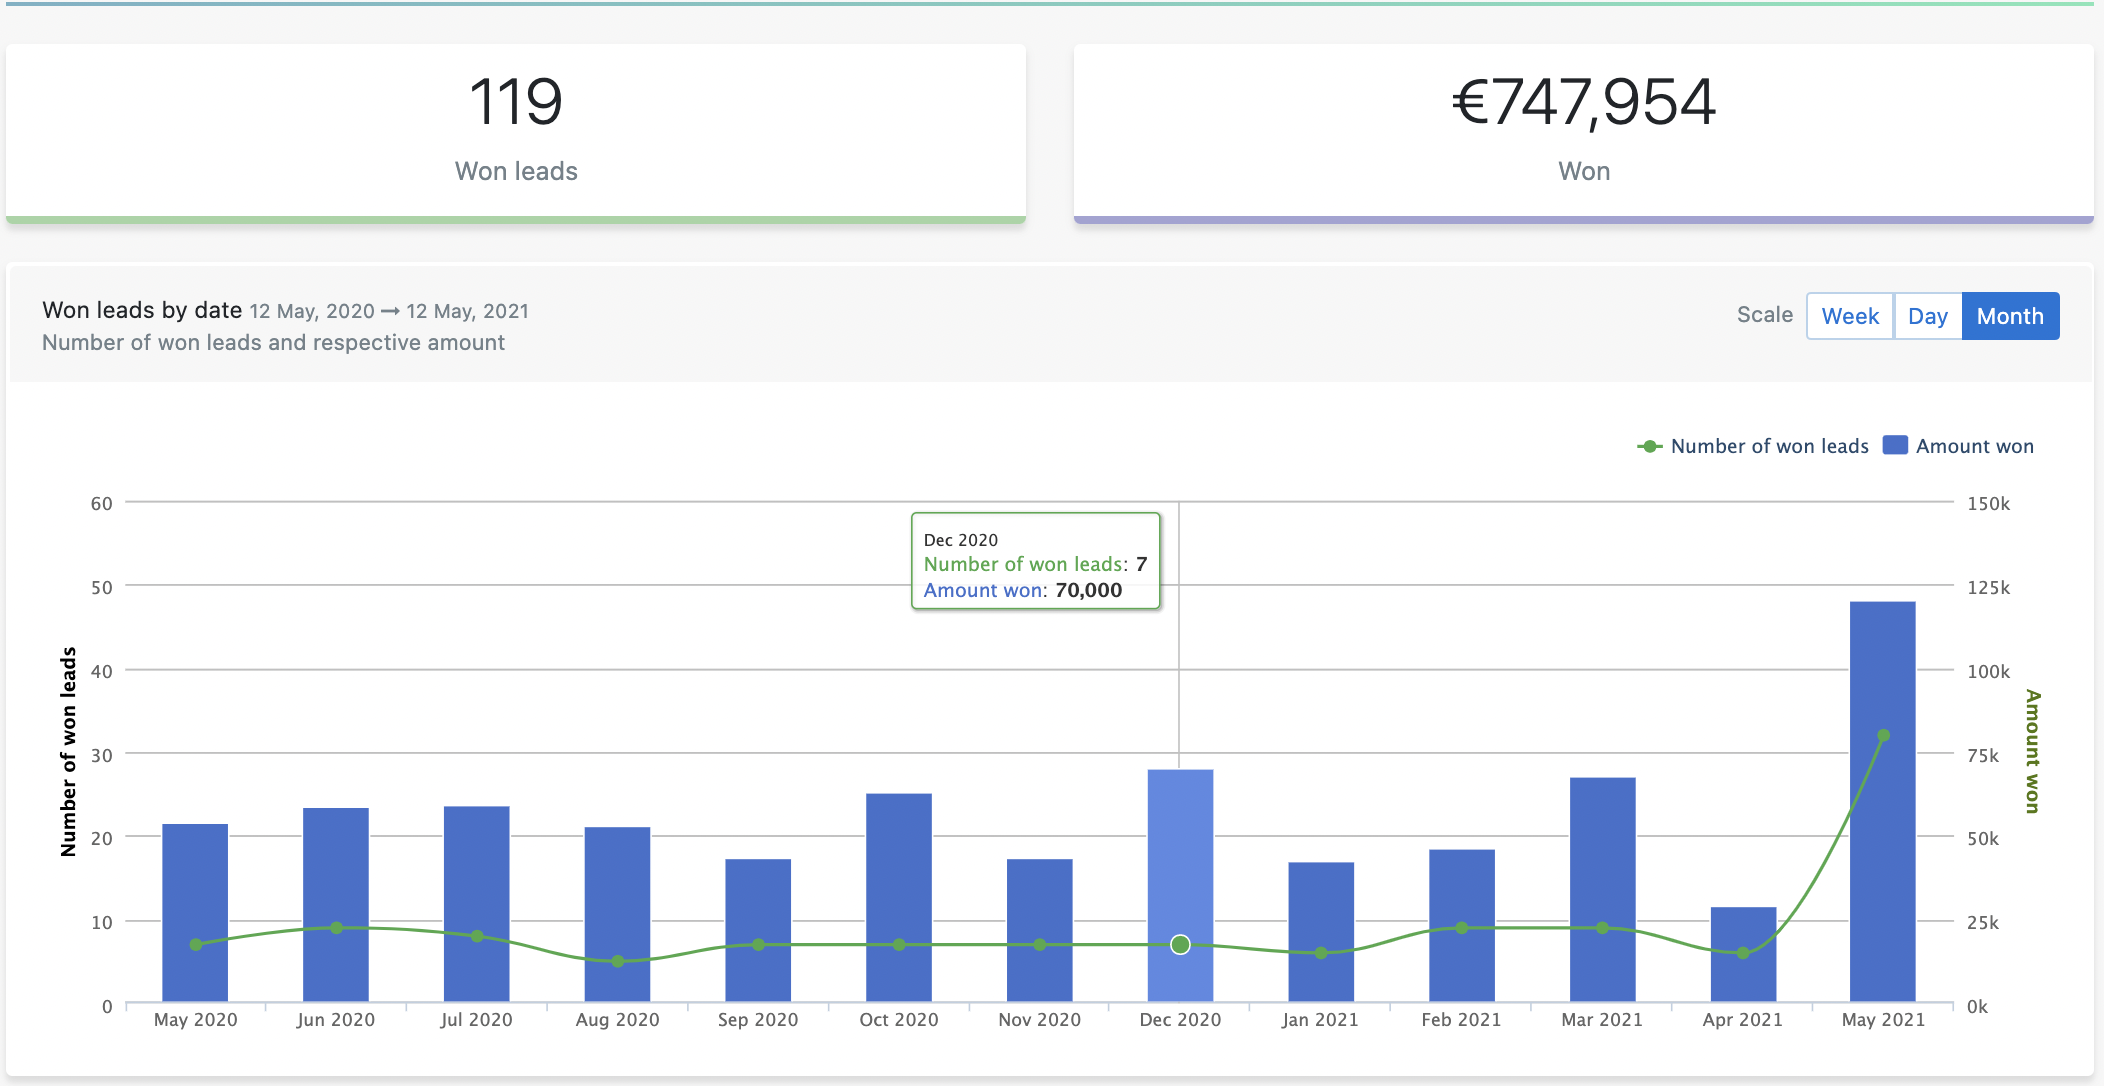
This report provides you with information about the leads that were created and won in a specific time period at the company level. You can also view the amount of money generated and the average time it took to win them.
Thanks to the different categories you've created in the Admin Panel, you will be able to have a clear understanding of what products/services you're selling more, the type of clients you're serving, where they're based, and what marketing efforts are or aren't working, etc.
This report can be filtered by:
- 1) Date
- 2) Tags
- 3) Pipeline
- 4) As Admin, you can filter by a user and by team
In the provided table below the chart, you'll find data grouped by date on how many leads were won and who they are through clickable links. You will also see the average number of days it took to close these leads, the total amount of money generated, and how much money the biggest lead has brought in.
Analyze your team's performance
In this report, you will find information on the leads that have been won at the user level.
See how many leads each sales rep has won, the average number of days it took for each to win them, the amount of revenue they have generated, and what's their best lead in terms of the amount of money they've generated for the company.

This report can be filtered by:
- 1) Date
- 2) Tags
- 3) Pipeline
- 4) As Admin, you can view data and filter by user and team